Cost
efficiency
Find avoidable complexity, over-specification and cost-to-serve hidden inside the portfolio.
Packaging intelligence for global brands
We help leadership teams make packaging decisions that are more profitable, lower-risk and easier to defend — across cost, carbon, supply and shelf impact.
Independent advisory. Technology-enabled. Built for complex portfolios.
ROI Calculator™
Start with two assumptions. Turn your annual packaging spend into a simple view of potential savings — then explore investment and payback when you need more detail.
Validate my opportunity ↗Before implementation costs. Adjust the assumptions to explore your scenario.
The economic picture
Annual estimates in USD at full implementation. These are scenarios, not client results or guaranteed savings.
Your starting annual packaging budget.
BASELINE / YEARCurrent spend minus potential annual savings.
SCENARIO / YEARAnnual savings divided across twelve months.
FULL IMPLEMENTATIONYour chosen reduction assumption, ready to validate.
ASSUMPTION / NOT A BENCHMARK$80,000 potential annual savings before implementation costs.
How it's calculated
A transparent calculation. Every result traces back to the assumptions you choose.
Enter annual packaging spend.
Choose a potential savings rate.
Spend × rate = annual savings.
Confirm feasibility, costs and timing.
Add an implementation budget and timing to estimate the first-year return.
Investment at month 0. Savings accrue evenly after implementation. No discounting, taxes, financing or revenue uplift included.
Annual savings = annual spend × reduction rate. Year-one gross savings = annual savings × (12 − implementation months) / 12. Year-one net benefit = gross savings − investment. ROI = net benefit / investment. Payback = implementation months + investment / monthly savings. If investment is zero, ROI is not applicable. If savings are zero, a positive investment does not pay back.
Illustrative planning model. Validate technical feasibility, supplier pricing and implementation costs before making a decision.
OPTIMIZATION, MADE TANGIBLE
Five visual examples of how packaging decisions can reduce excess and create opportunities to improve margin.
 View full image ↗
01 / Labels
Reduce unnecessary label surface while retaining brand presence and required information. Validate application, adhesion and regulatory content.
 View full image ↗
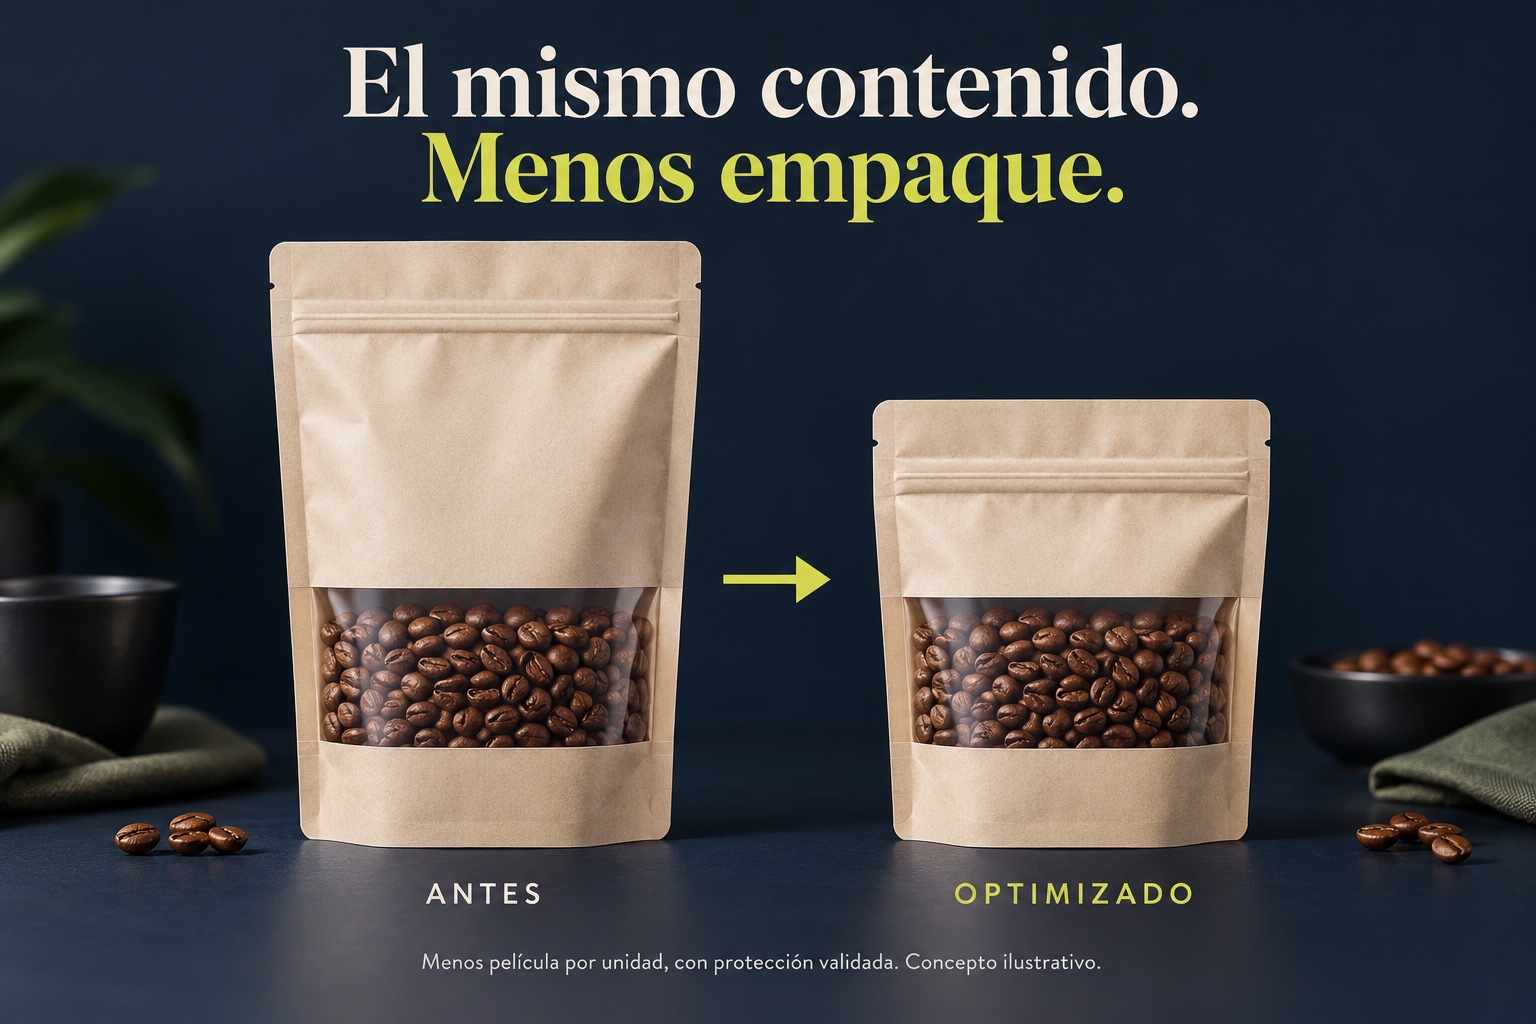
02 / Pouch
Right-size pouch dimensions around fill volume, sealing and protection needs. Less excess material can improve cost per unit.
 View full image ↗
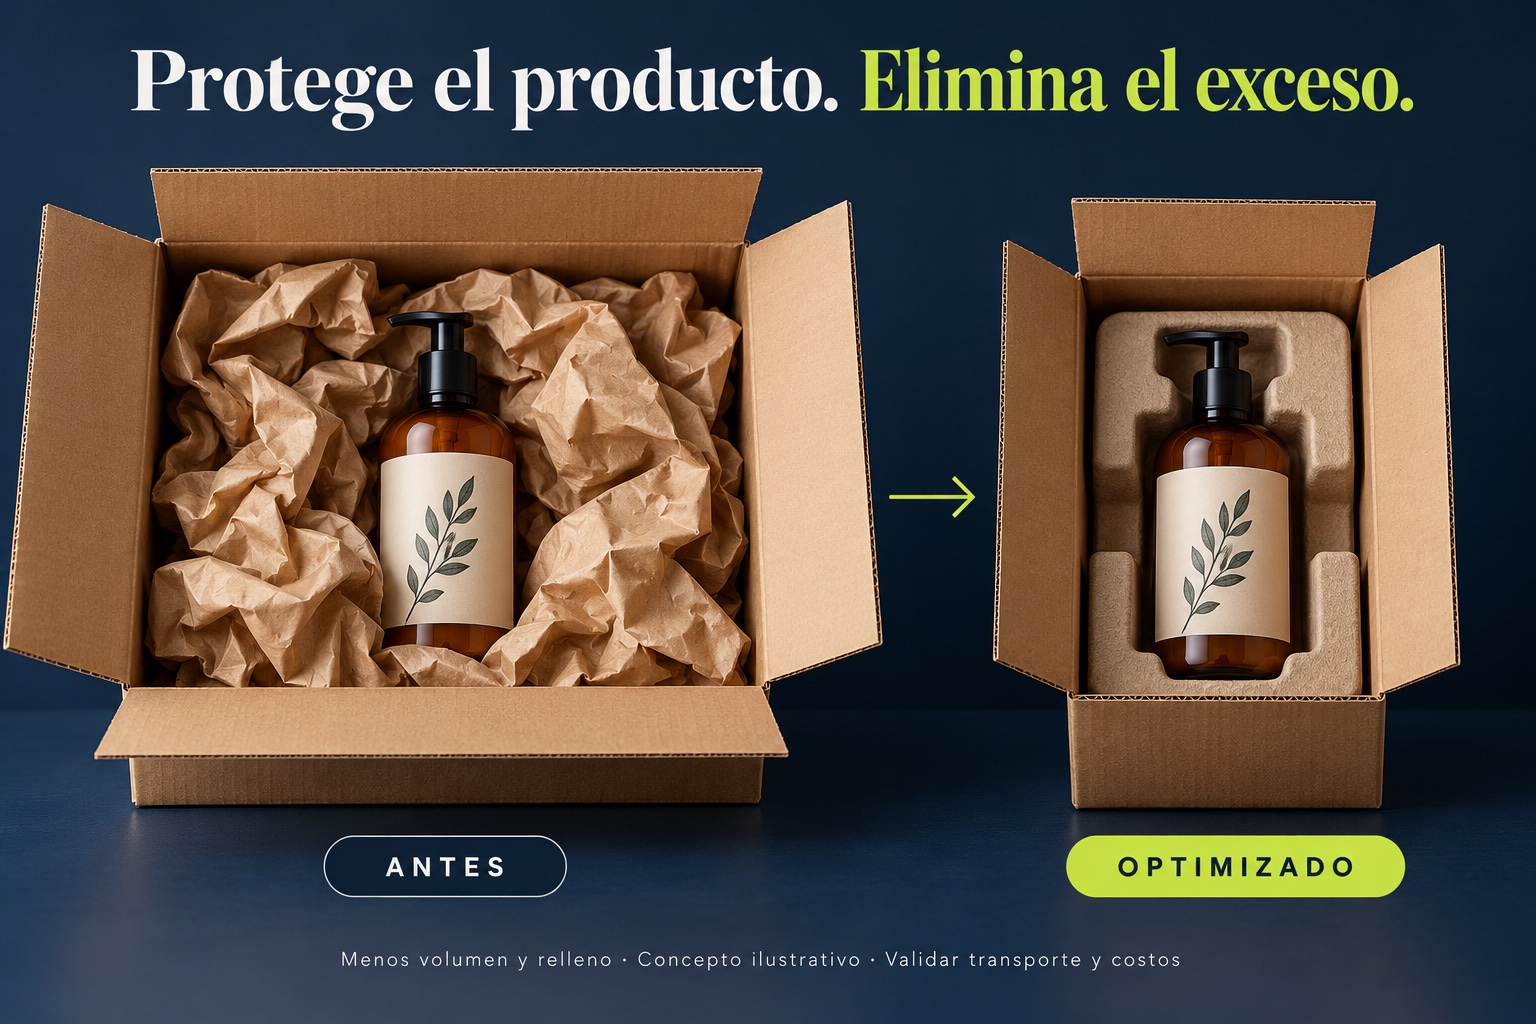
03 / Cartons
Match carton size and inserts to the product. Evaluate material, packing labor and shipping volume together, then validate transit performance.
 View full image ↗
04 / Containers
Review wall and base thickness to identify material efficiency opportunities. Confirm strength, compatibility and manufacturing feasibility before changing a specification.
 View full image ↗
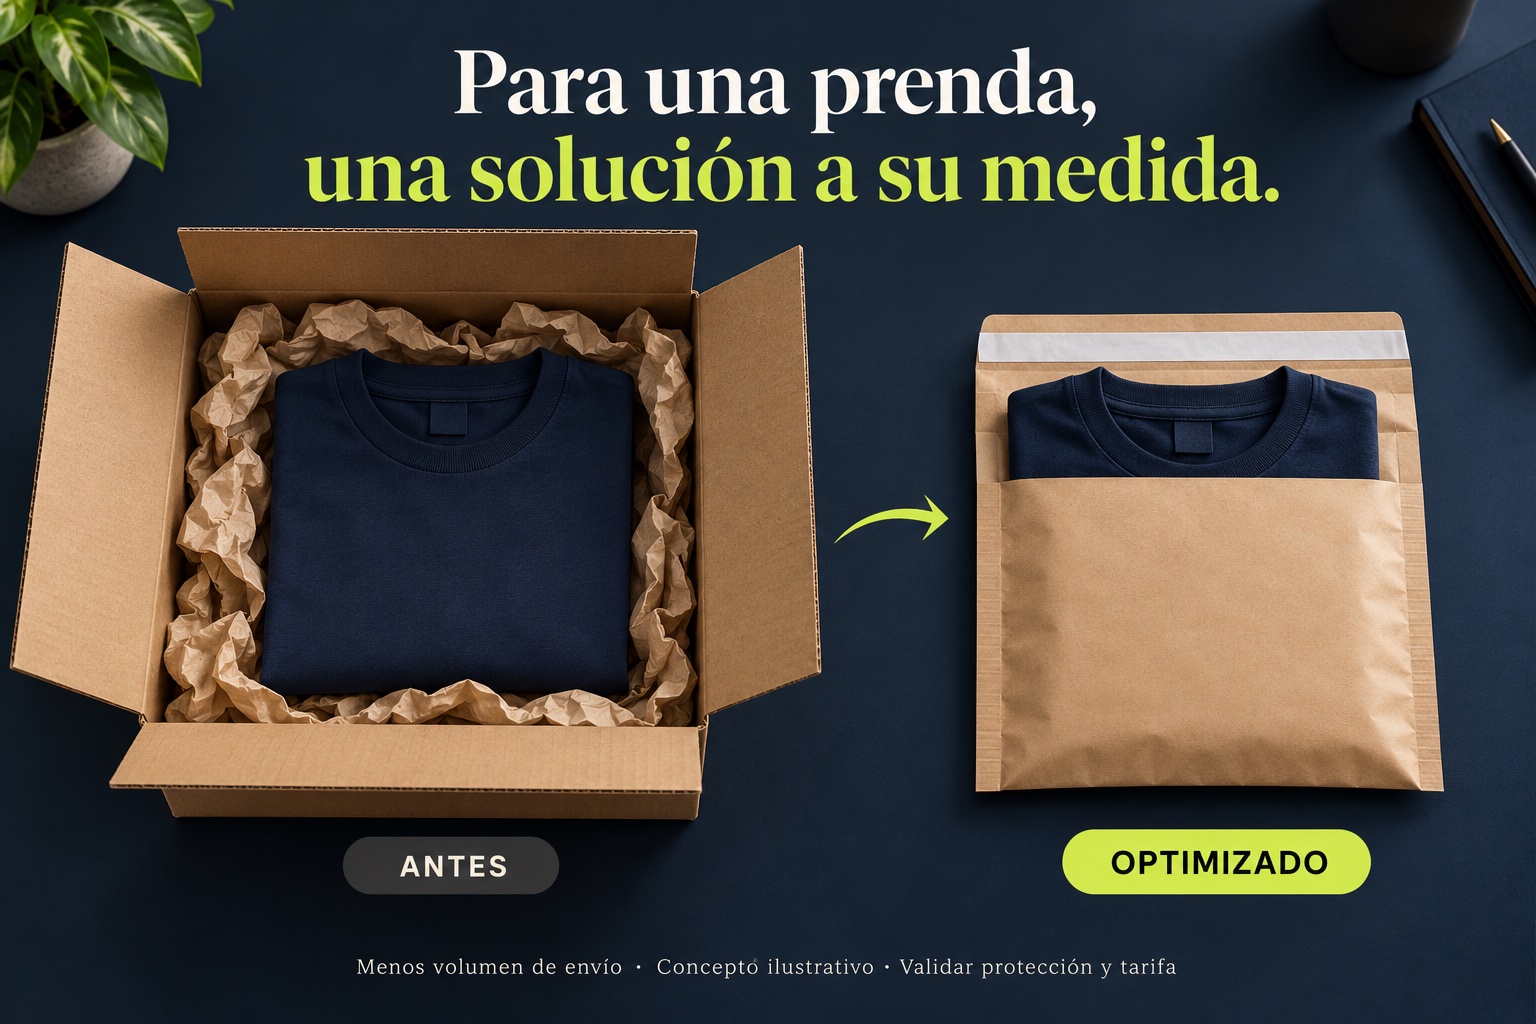
05 / E-commerce
For suitable apparel shipments, a fitted mailer may replace a bulky box. Validate product protection and the actual carrier tariff.
Illustrative concepts, not client projects or validated savings. Any change requires technical, regulatory and commercial validation.
Explore opportunities in your portfolio ↗The problem
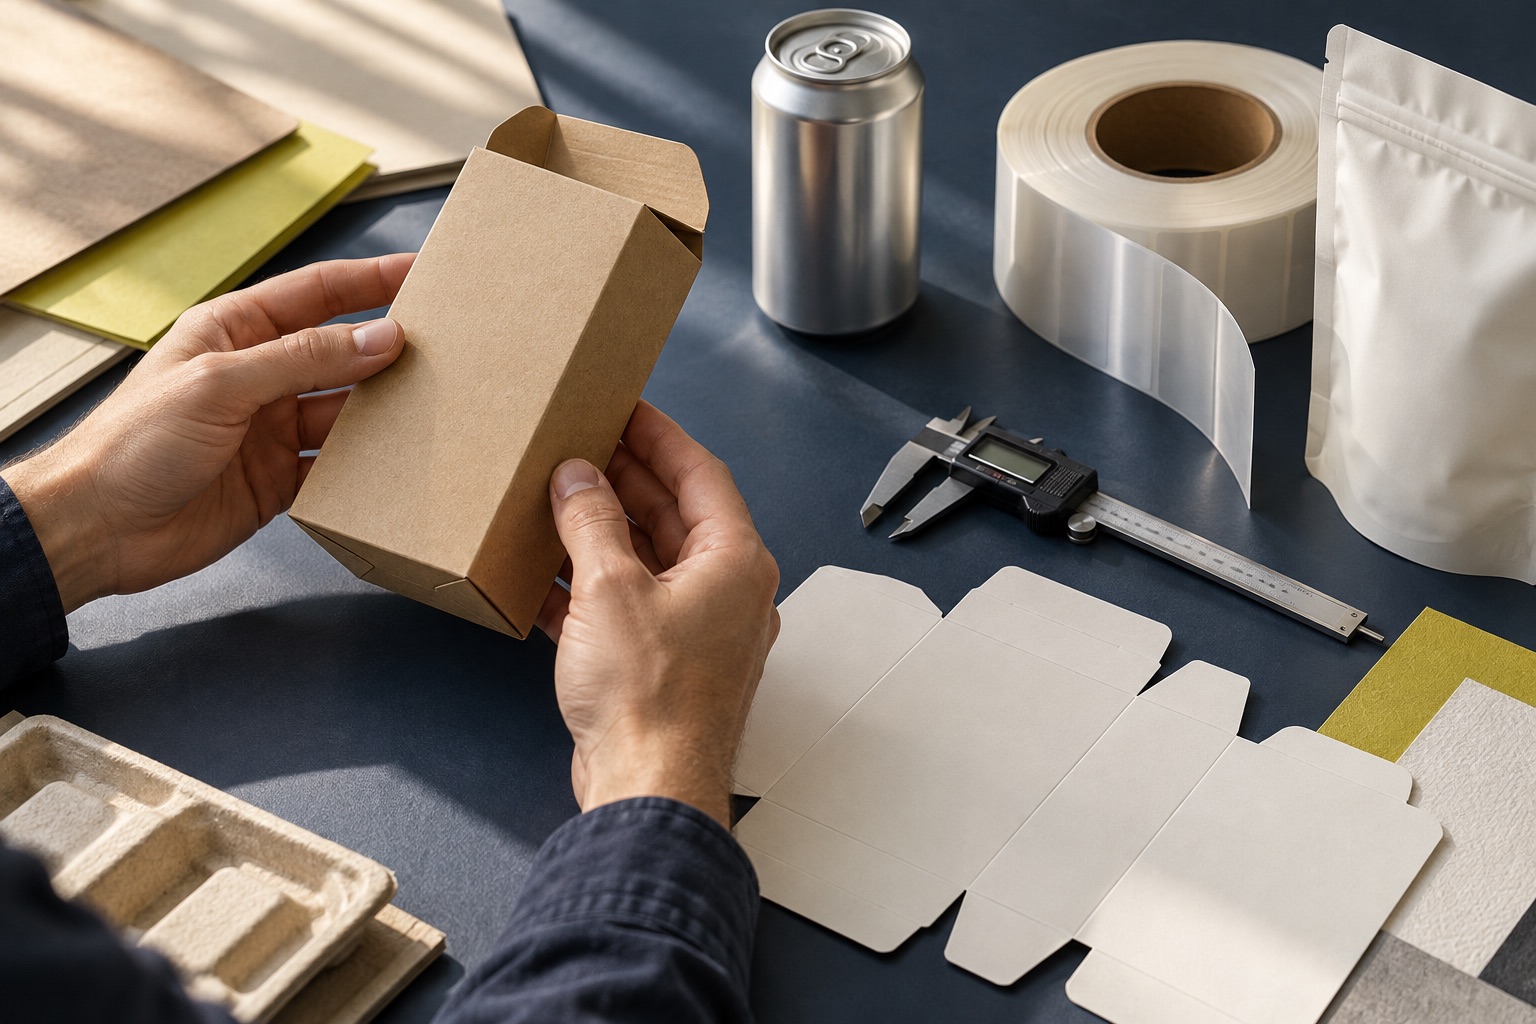
Teams are asked to protect margin, improve sustainability, prevent disruption and win at shelf — often with fragmented specifications, supplier data and decision rights. We bring those choices into one clear operating view.
Start with your portfolioWhat we measure
Our advisory framework makes the performance of a pack visible before you commit capital, change a supplier or take a new format to market.
Find avoidable complexity, over-specification and cost-to-serve hidden inside the portfolio.
Turn material, format and operational choices into a defensible path to lower impact.
Surface concentration, lead-time and compliance exposure before it becomes a disruption.
Protect the role packaging plays in usability, differentiation and category performance.
The 4D method
A structured engagement model for moving from a complex packaging question to a clear, implementable decision.
Establish a fact base across SKUs, specifications, suppliers, materials, markets and business constraints.
Model credible alternatives and trade-offs, including technical feasibility, commercial impact and compliance.
Sequence the transition around qualification, supplier readiness, inventory, operations and governance.
Give leaders a measurement model to sustain performance as prices, regulations and portfolios change.
Capabilities
Our named capabilities describe the operating system we are building around our advisory work. Engagements are led by experienced practitioners; tools support the work where they create real decision advantage.
A consistent way to frame portfolio performance across cost, carbon, supply and shelf impact.
Advisory frameworkA developing decision-support capability for exploring feasible material, format and structural alternatives.
In developmentA structured comparison approach to help teams place decisions in category and market context.
Advisory capabilityA clear pathway for connecting packaging choices to more credible carbon conversations.
Advisory capabilityWhere we focus
We are built for portfolios where packaging affects margin, compliance, operations and how the brand shows up in the world.
What a diagnostic gives you
“A shared fact base for the packaging decisions leaders need to make next.”
Research & insight
Perspective
Field note
Briefing
A focused first step
A focused conversation about your packaging challenge, the opportunities worth investigating and the next practical step.
20-minute consultation · One packaging priority
An initial advisory session. Detailed engineering, lab testing and a full portfolio study are outside this session.